Sarah Bloch-Elkouby’s Poster
Concordance Between Measures of Outcome and Assessment of Possible Deterioration
by Sarah Bloch-Elkouby1, J. Christopher Muran1, Bernard Gorman1, Jeremy Safran1, & Arnold Winston1
1 Adelphi University
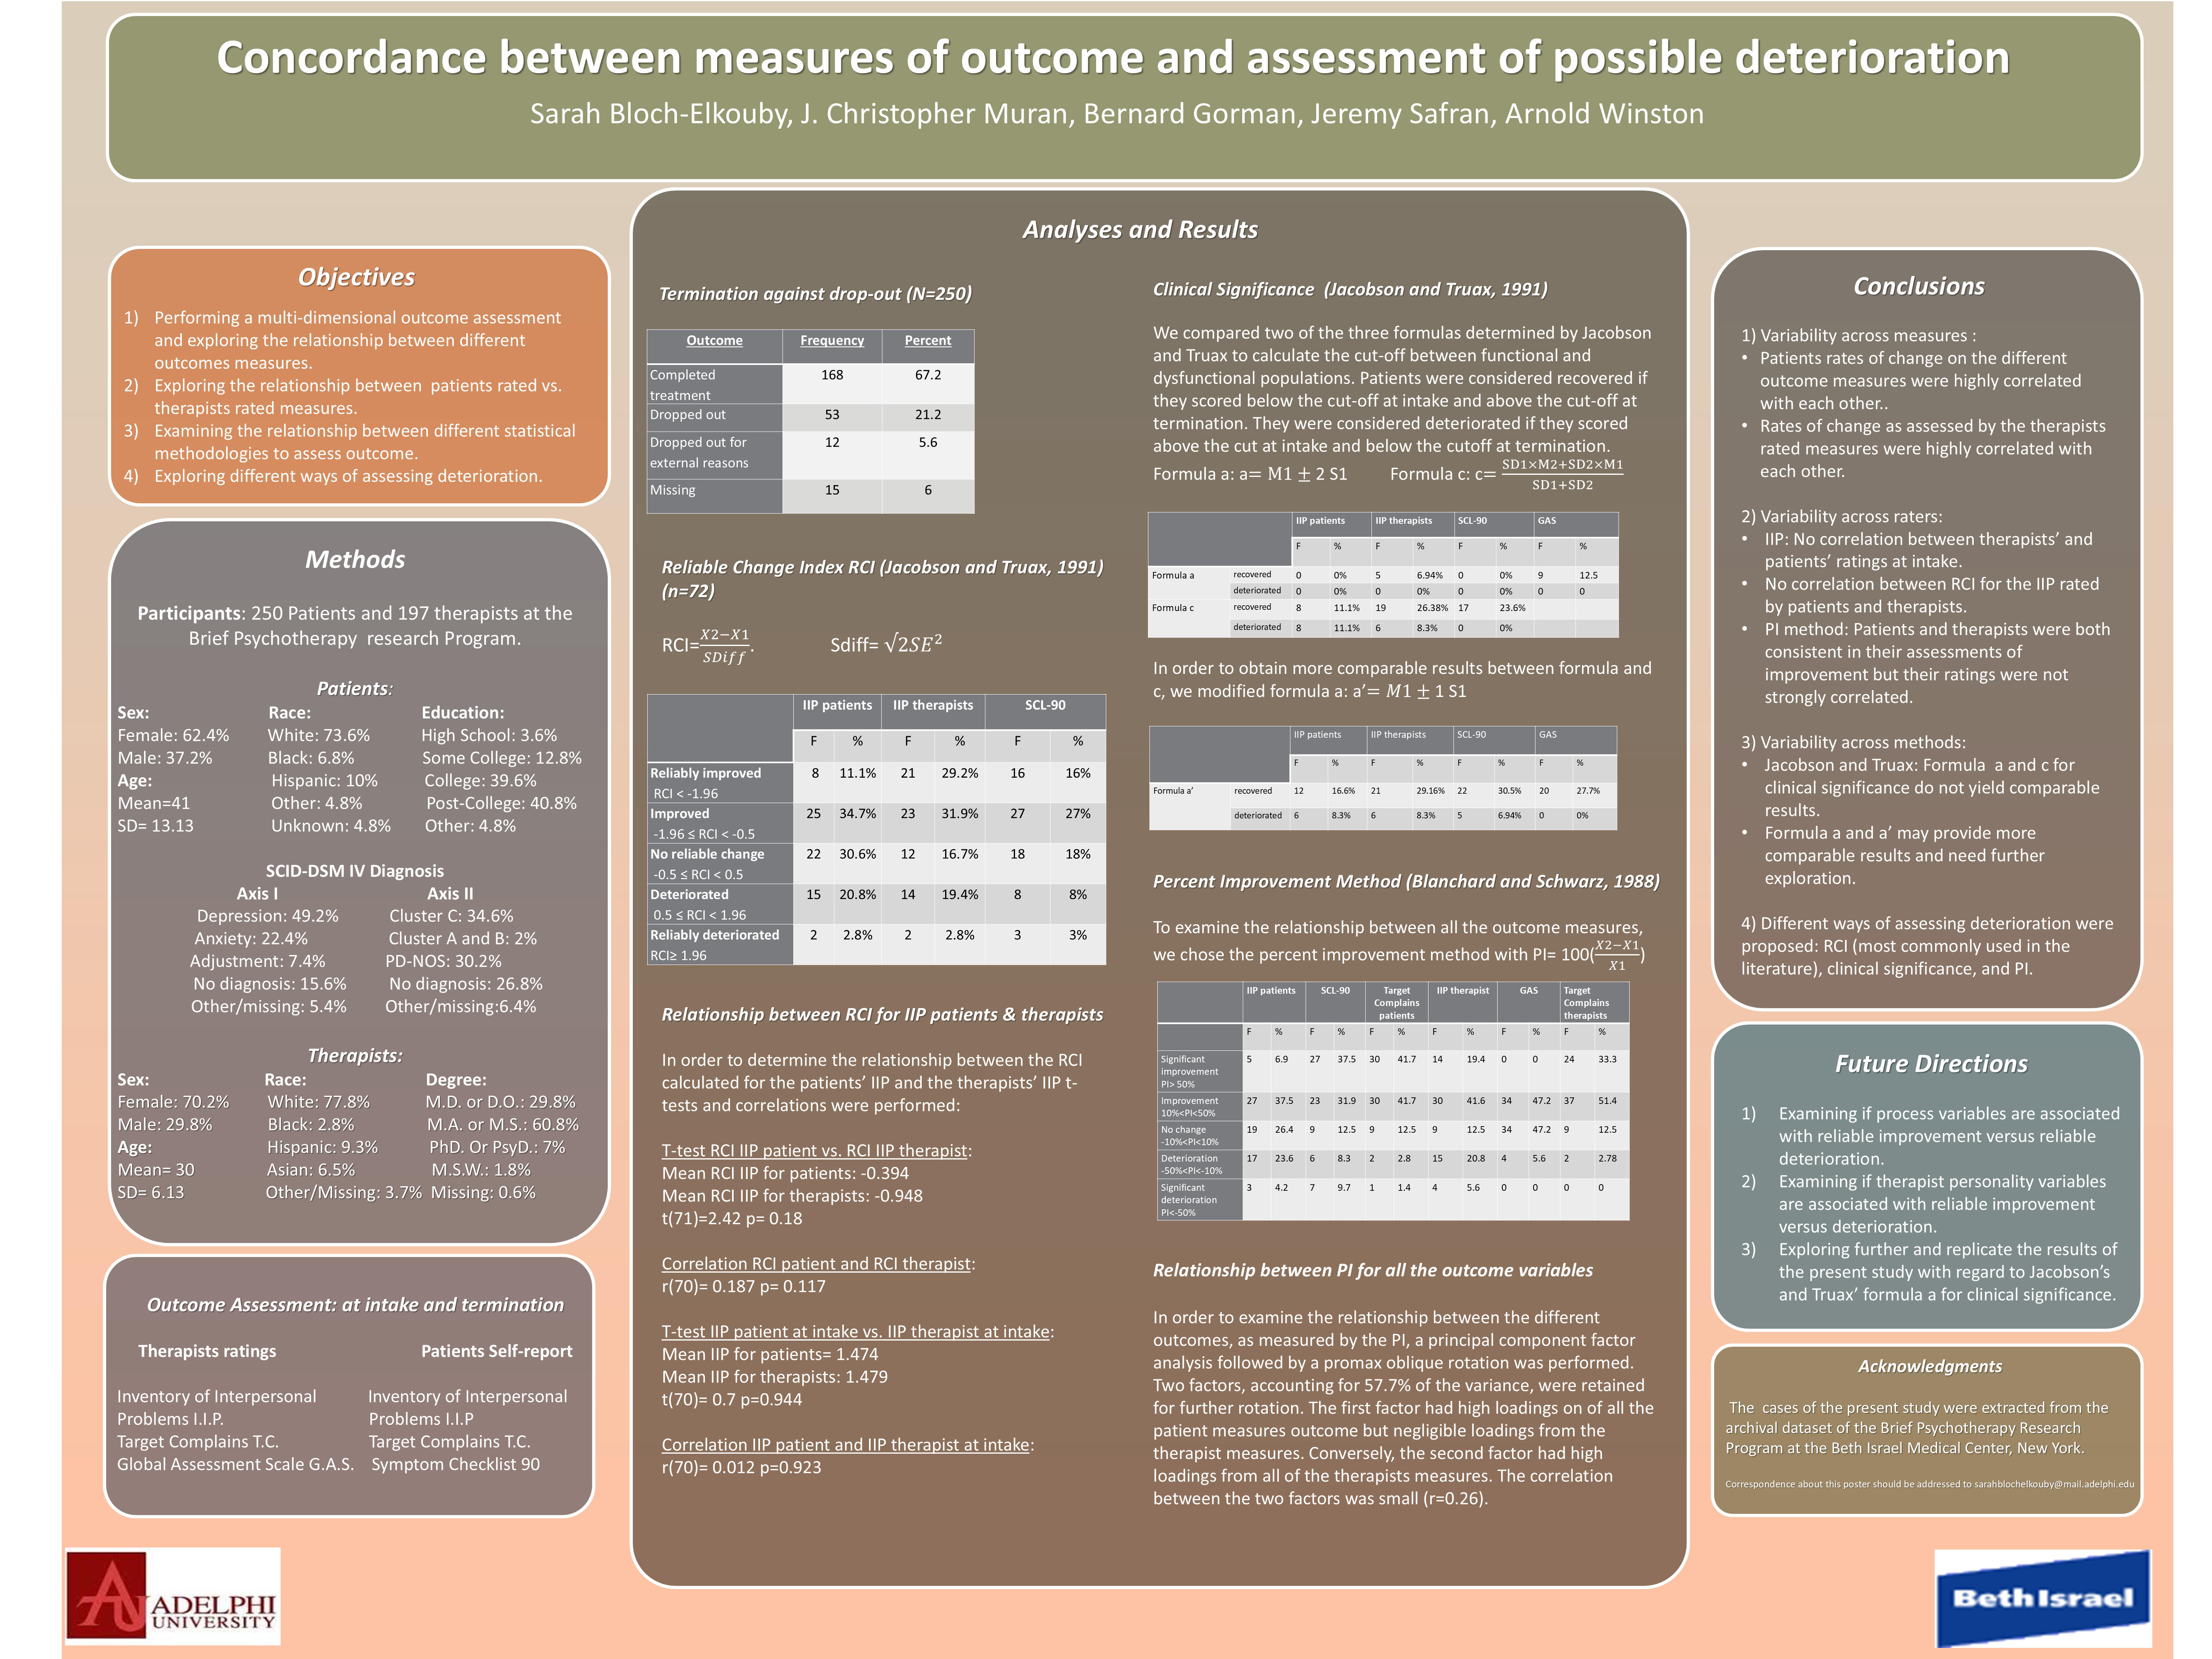
Objective:
- Performing a multi-dimensional outcome assessment and exploring the relationship between different outcomes measures.
- Exploring the relationship between patients rated vs. therapists rated measures.
- Examining the relationship between different statistical methodologies to assess outcome.
- Exploring different ways of assessing deterioration.
Method:
Table 1: Patient Characteristics
| Sex | Race | Education | DSM: Axis I | DSM: Axis II |
| Female: 62.4% | White: 73.6% | High School: 3.6% | Depression: 49.2% | Cluster C: 34.6% |
| Male: 37.2% | Black: 6.8% | Some College: 12.8% | Anxiety: 22.4% | Cluster A and B: 2% |
| Age | Hispanic: 10% | College: 39.6% | Adjustment: 7.4% | PD-NOS: 30.2% |
| Mean=41 | Other: 4.8% | Post-College: 40.8% | No diagnosis: 15.6% | No diagnosis: 26.8% |
| SD= 13.13 | Unknown: 4.8% | Other: 4.8% | Other/missing: 5.4% | Other/missing:6.4% |
Table 2: Therapist Characteristics
| Sex | Race | Degree |
| Female: 70.2% | White: 77.8% | M.D. or D.O.: 29.8% |
| Male: 29.8% | Black: 2.8% | M.A. or M.S.: 60.8% |
| Age | Hispanic: 9.3% | PhD. Or PsyD.: 7% |
| Mean= 30 | Asian: 6.5% | M.S.W.: 1.8% |
| SD= 6.13 | Other/Missing: 3.7% | Missing: 0.6% |
Outcome Assessments:
| Therapists ratings | Patients Self-report |
| Inventory of Interpersonal Problems (IIP) | IPP |
| Target Complains (TC) | TC |
| Global Assessment Scale (GAS) | Symptom Checklist 90 |
Results:
Table 4: Termination against drop-out (N=250)
| Outcome | Frequency | Percent |
| Completed treatment | 168 | 67.2 |
| Dropped out | 53 | 21.2 |
| Dropped out for external reasons | 12 | 5.6 |
| Missing | 15 | 6 |
Table 5: Reliable Change Index RCI (Jacobson & Truax, 1991) (N=72)
$$ \text{RCI} = \frac{X_2 - X_1}{SDiff} \hspace{2cm} SDiff = \sqrt{2(SE)^2} $$
| Outcome | IIP patients F | IIP patients % | IIP therapists F | IIP therapists % | SCL-90 F | SCL-90 % |
| Reliably improved (RCI < -1.96) | 8 | 11.1% | 21 | 29.2% | 16 | 16% |
| Improved (-1.96 ≤ RCI < -0.5) | 25 | 34.7% | 23 | 31.9% | 27 | 27% |
| No reliable change (-0.5 ≤ RCI < 0.5) | 22 | 30.6% | 12 | 16.7% | 18 | 18% |
| Deteriorated (0.5 ≤ RCI < 1.96) | 15 | 20.8% | 14 | 19.4% | 8 | 8% |
| Reliably deteriorated (RCI ≥ 1.96) | 2 | 2.8% | 2 | 2.8% | 3 | 3% |
Relationship Between RCI for IIP Patients & Therapists
In order to determine the relationship between the RCI calculated for the patients’ IIP and the therapists’ IIP t-tests and correlations were performed:
| RCI IIP patient | Therapist | IIP patient at intake | Therapist |
| m = -0.394 | m = -0.948 | m = 1.474 | m = 1.479 |
| t(71) = 2.42 | p = 0.18 | t(70) = 0.7 | p = 0.944 |
| r(70) = 0.187 | p = 0.117 | r(70) = 0.012 | p = 0.923 |
Clinical Significance (Jacobson & Truax, 1991)
We compared two of the three formulas determined by Jacobson and Truax to calculate the cut-off between functional and dysfunctional populations. Patients were considered recovered if they scored below the cut-off at intake and above the cut-off at termination. They were considered deteriorated if they scored above the cut at intake and below the cutoff at termination.
$$ \text{Formula a: } a = M_1 \pm 2S_1 \qquad \text{Formula c: } c = \frac{SD_1 \times M_2 + SD_2 \times M_1}{SD_1 + SD_2} $$
| Formula | Outcome | IIP patients F | IIP patients % | IIP therapists F | IIP therapists % | SCL-90 F | SCL-90 % | GAS F | GAS % |
| a | recovered | 0 | 0% | 5 | 6.94% | 0 | 0% | 9 | 12.5 |
| a | deteriorated | 0 | 0% | 0 | 0% | 0 | 0% | 0 | 0 |
| c | recovered | 8 | 11.1% | 19 | 26.38% | 17 | 23.6% | ||
| c | deteriorated | 8 | 11.1% | 6 | 8.3% | 0 | 0% |
In order to obtain more comparable results between formula and c, we modified formula a: $$ a’ = M_1 \pm 1S_1 $$
| Formula | Outcome | IIP patients F | IIP patients % | IIP therapists F | IIP therapists % | SCL-90 F | SCL-90 % | GAS F | GAS % |
| Formula a’ | recovered | 12 | 16.6% | 21 | 29.16% | 22 | 30.5% | 20 | 27.7% |
| Formula a’ | deteriorated | 6 | 8.3% | 6 | 8.3% | 5 | 6.94% | 0 | 0% |
Percent Improvement (PI) Method (Blanchard & Schwarz, 1988)
To examine the relationship between all the outcome measures, we chose the percent improvement method with $$ PI = 100 \left( \frac{X_2 - X_1}{X_1} \right) $$
Relationship Between PI for All the Outcome Variables
In order to examine the relationship between the different outcomes, as measured by the PI, a principal component factor analysis followed by a promax oblique rotation was performed. Two factors, accounting for 57.7% of the variance, were retained for further rotation. The first factor had high loadings on of all the patient measures outcome but negligible loadings from the therapist measures. Conversely, the second factor had high loadings from all of the therapists measures. The correlation between the two factors was small (r=0.26).
Conclusion:
- Variability across measures :
- Patients rates of change on the different outcome measures were highly correlated with each other.
- Rates of change as assessed by the therapists rated measures were highly correlated with each other.
- Variability across raters:
- IIP: No correlation between therapists’ and patients’ ratings at intake.
- No correlation between RCI for the IIP rated by patients and therapists.
- PI method: Patients and therapists were both consistent in their assessments of improvement but their ratings were not strongly correlated.
- Variability across methods:
- Jacobson and Truax: Formula a and c for clinical significance do not yield comparable results.
- Formula a and a’ may provide more comparable results and need further exploration.
- Different ways of assessing deterioration were proposed: RCI (most commonly used in the literature), clinical significance, and PI.
Future Directions:
- Examining if process variables are associated with reliable improvement versus reliable deterioration.
- Examining if therapist personality variables are associated with reliable improvement versus deterioration.
- Exploring further and replicate the results of the present study with regard to Jacobson’s and Truax’ formula a for clinical significance.
Acknowledgment:
The cases of the present study were extracted from the archival dataset of the Brief Psychotherapy Research Program at the Beth Israel Medical Center, New York.